
Common Features
Many features in SWLog span usage across both broadcast logging and amateur radio logging.
Themes & Fonts
SWLog supports light, dark, and gray themes all with variants of serif, sans-serif, and fixed-width fonts.
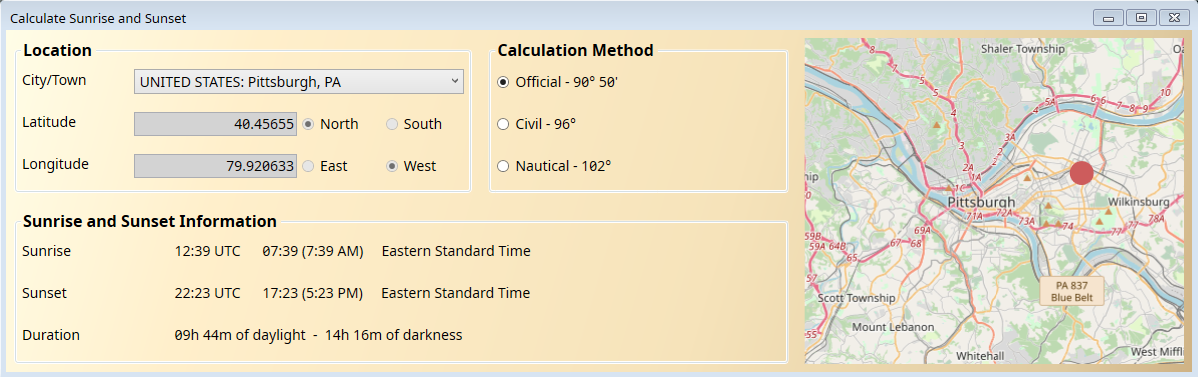
Sunrise / Sunset
Precise sunrise and sunset times can be calculated from a pre-defined list of over 15,000 places or any lat/long combination can be entered as well.
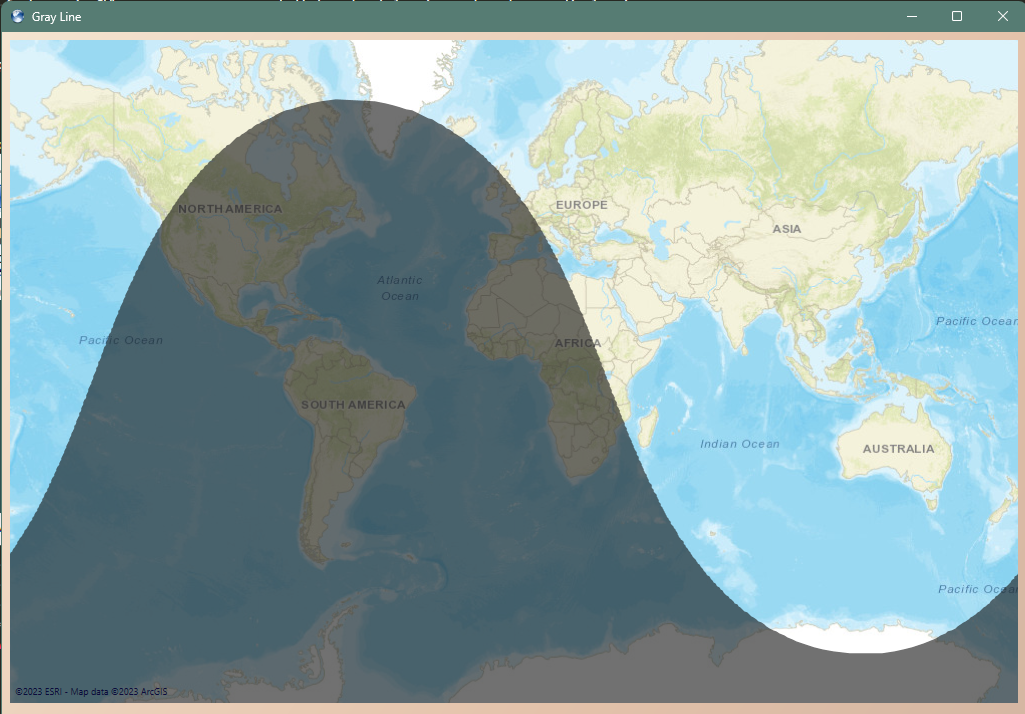
Gray Line
The current gray line can be displayed, and the map is continually updated. The functionality is currently basic; more features are being added.
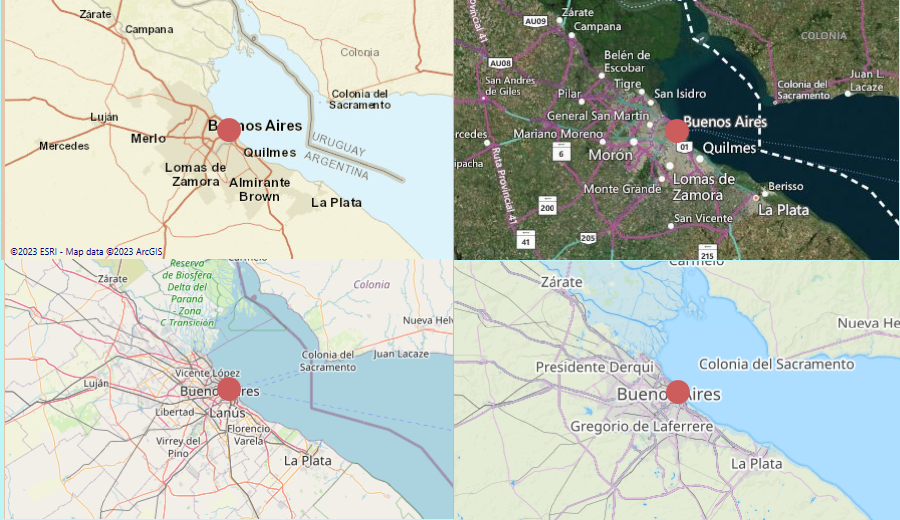
Map Providers
Registered users have a choice of multiple map providers including ArcGIS, Bing, Open Cycle, Open Sea, Open Street, and WikiMapia.
Additionally map tiles are cached in the database not only for faster performance but also for off-line use. In a typical scenario where one has a significant number of QSOs at home and conducts POTA operations on the weekend, then the map tiles will already be cached, thus enabling all of the maps to function without gaps with no Internet connectivity in the field.
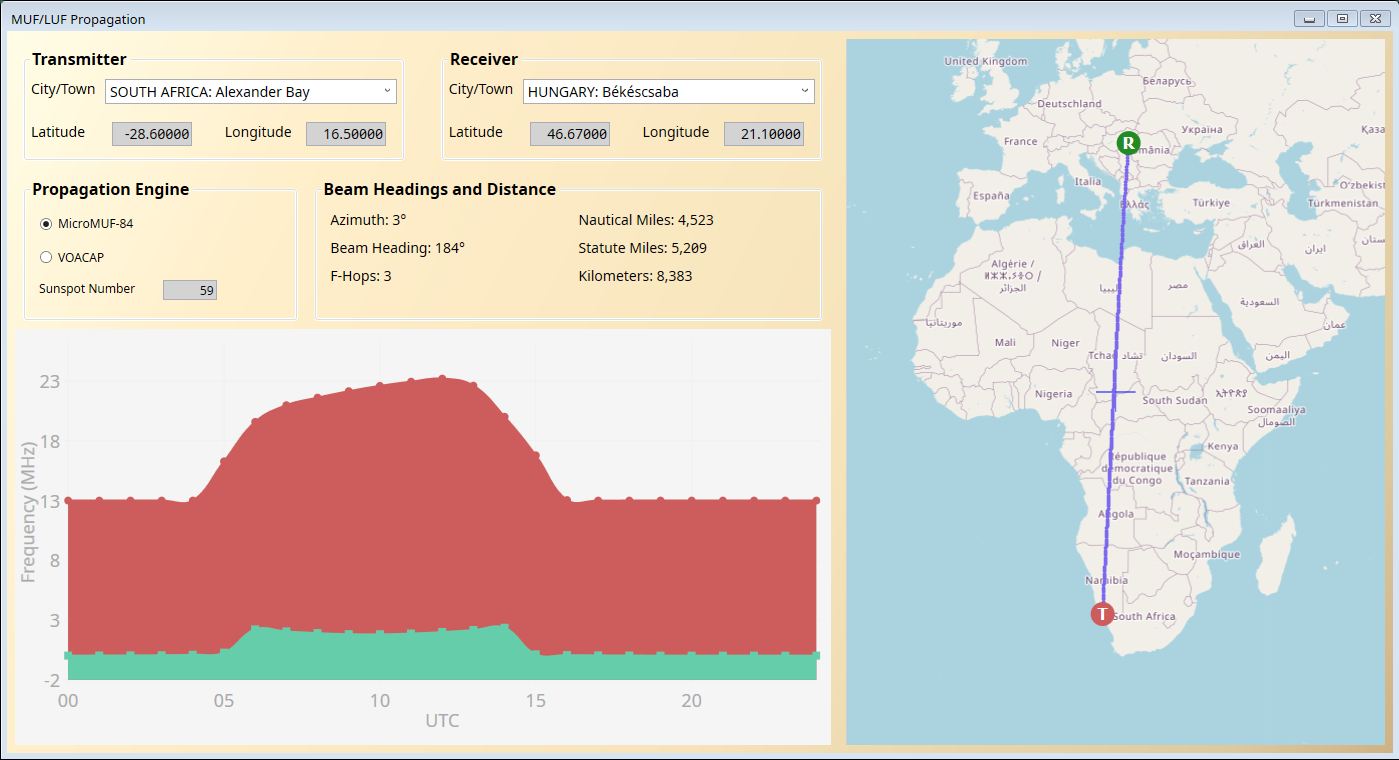
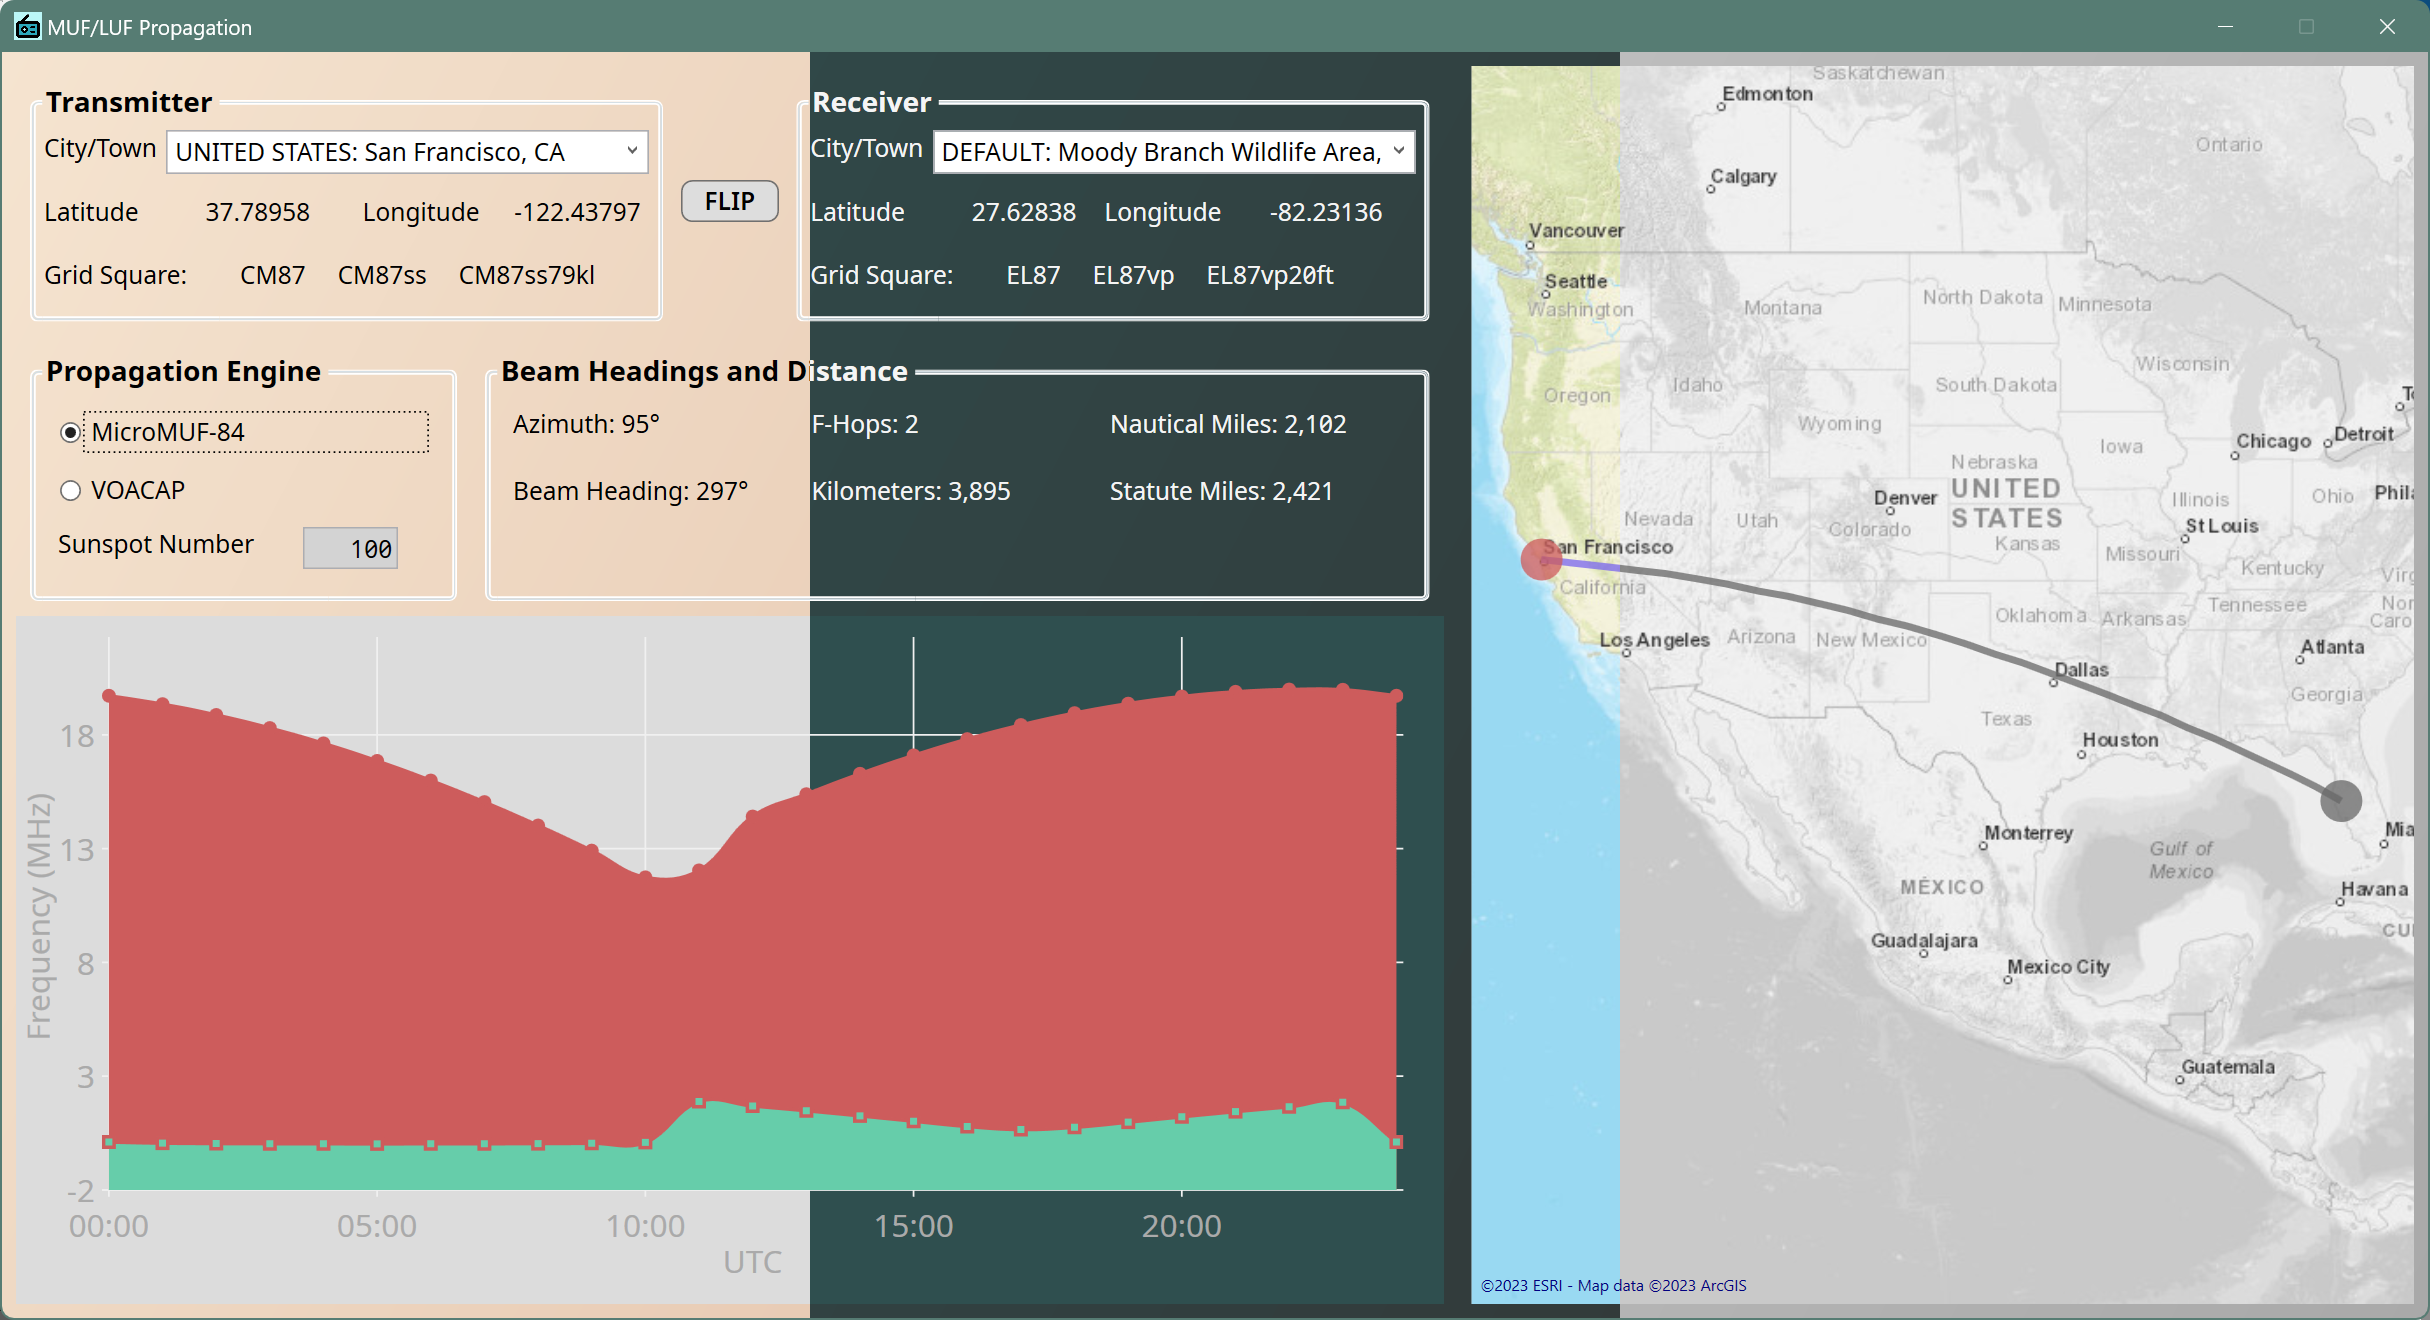
Propagation MICROMUF-84
Built into SWLog is the MICROMUF-84 propagation engine, which calculates the minimum and maximum usable frequencies for a transmission at a specific time given a specific sunspot number. Also calculated are the azimuth, beam heading, f-hops, and distance.
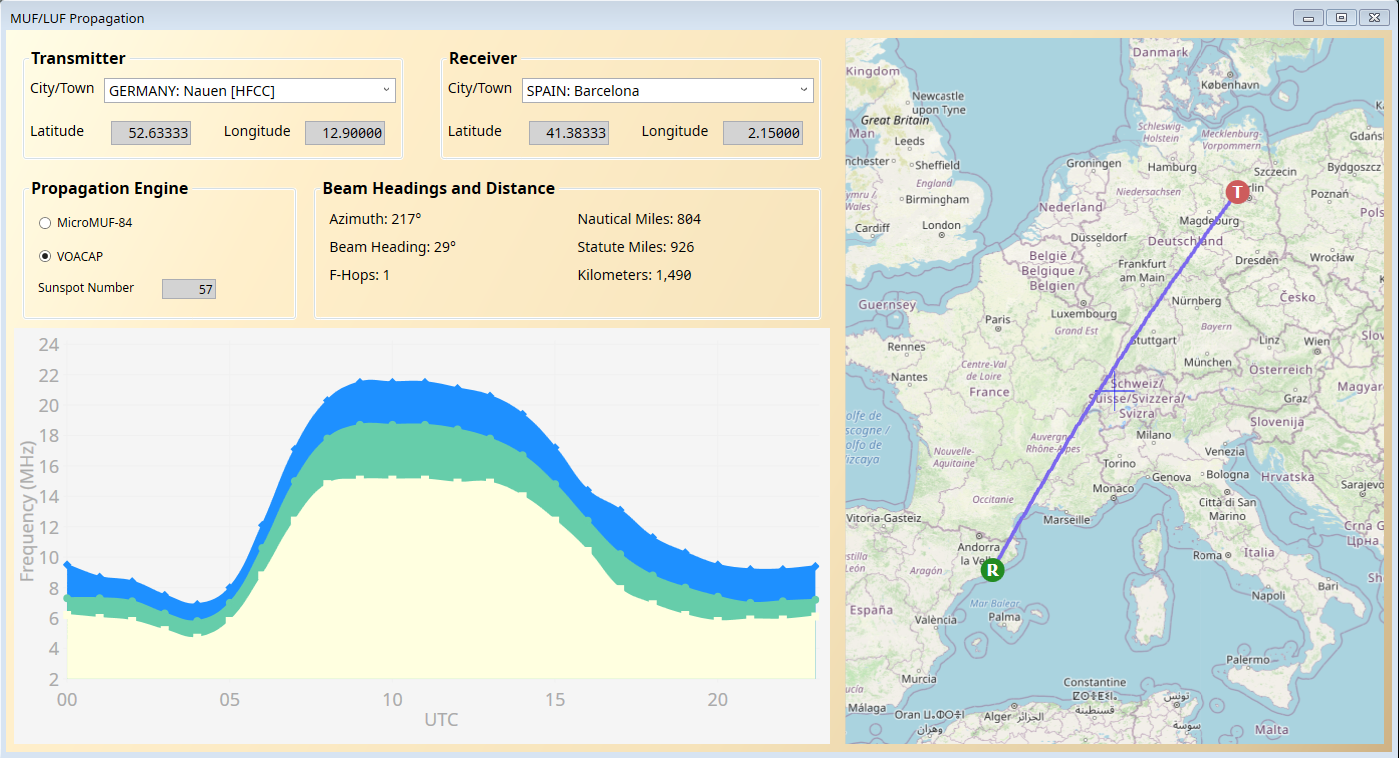
Additional Propagation Engines
In addition to using the MicroMUF-84 propagation prediction engine, registered versions can utilize the CMUF (US Navy), EINMUF (US Navy), P533 (ITU-R P.533), and VOACAP propagation engines. The algorithms for EINMUF and P533 are integreated into SWLog. VOACAP is handled via a separate application. The installation package for VOACAP is an optional part of the installation for SWLog for a seamless experience.
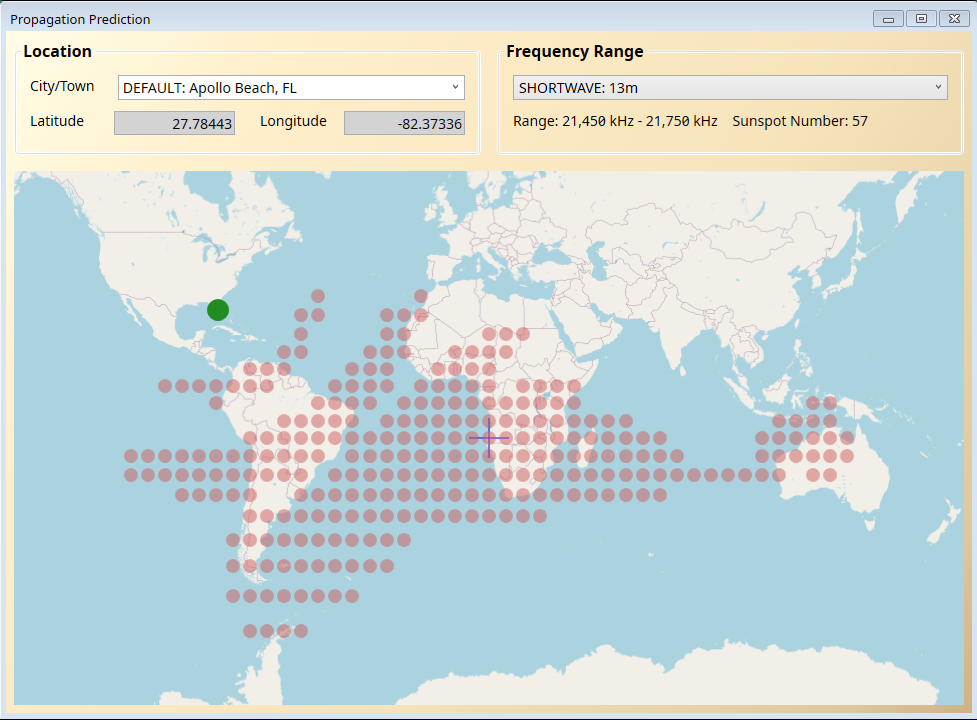
Propagation Prediction
In essentially an inverse version of a typical point-to-point prediction scenario, SWLog can take the current QTH and predict where the signal will reach given the current sunspot number.
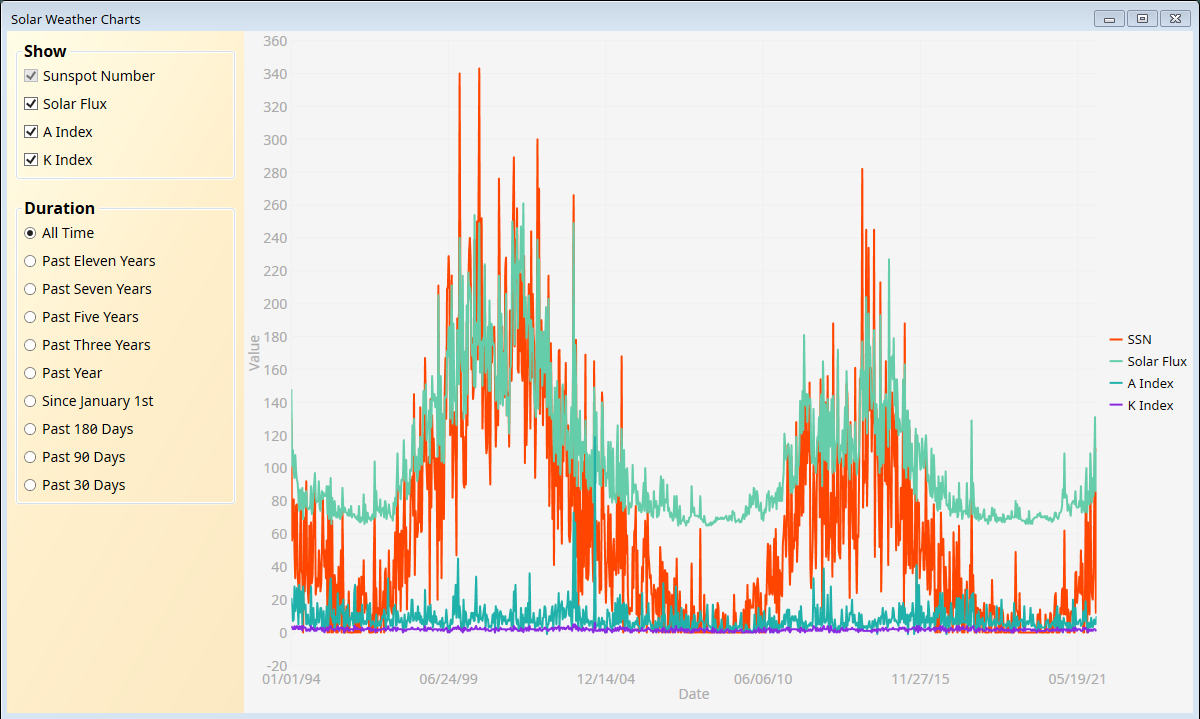
Solar Weather History
SWLog will download the process the daily archive of solar weather data from NOAA going back to 1994.
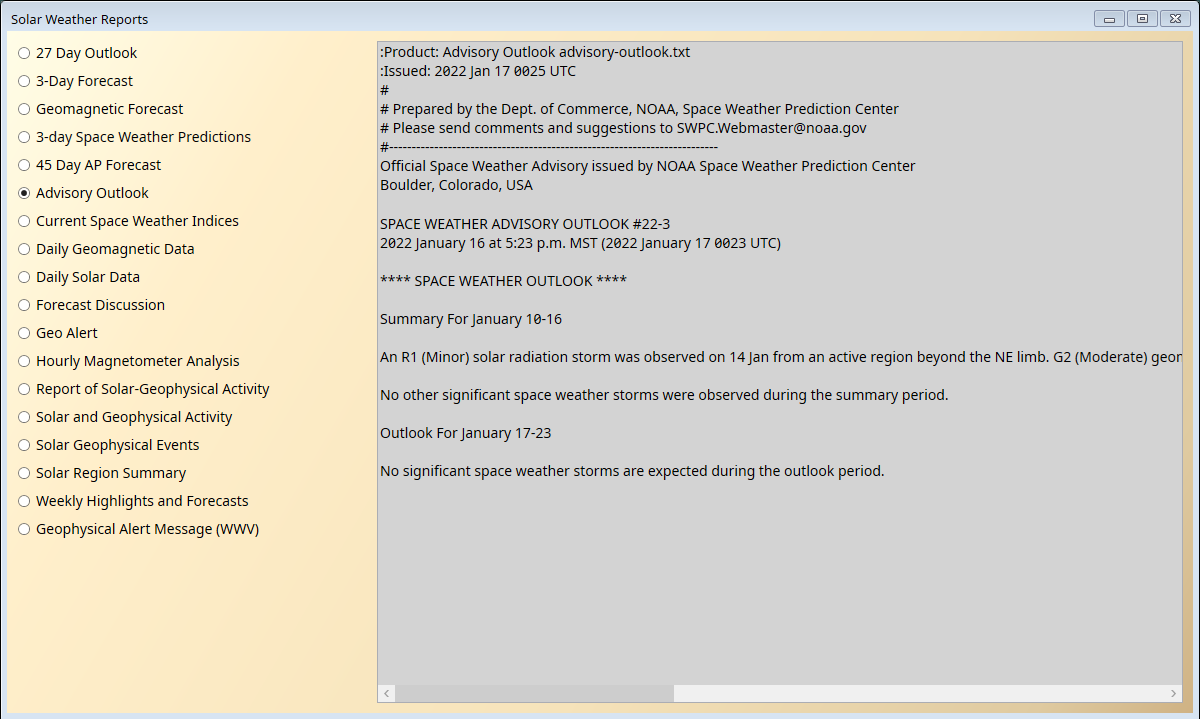
NOAA Data
An front-end interface to various NOAA reports allows the data to be easily viewed without having to search or use bookmarks.
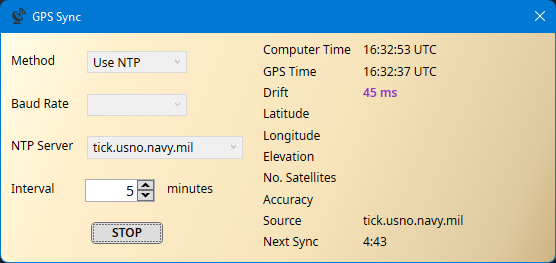
GPS Synchronization - NTP
SWLog provides a GPS Sync utility that will synchronize the computer PC clock with an Internet time source via the NTP protocol.
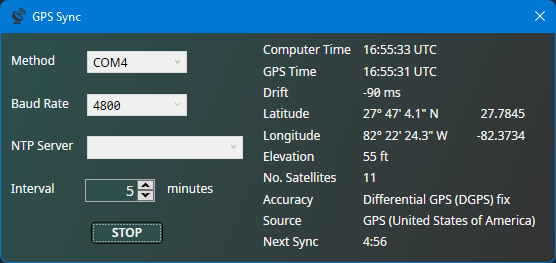
GPS Synchronization - Serial Port
A lower latency and off-grid for GPS synchronization is to use a USB GPS device. SWLog will synchronize to any USB device that provides NMEA packets.
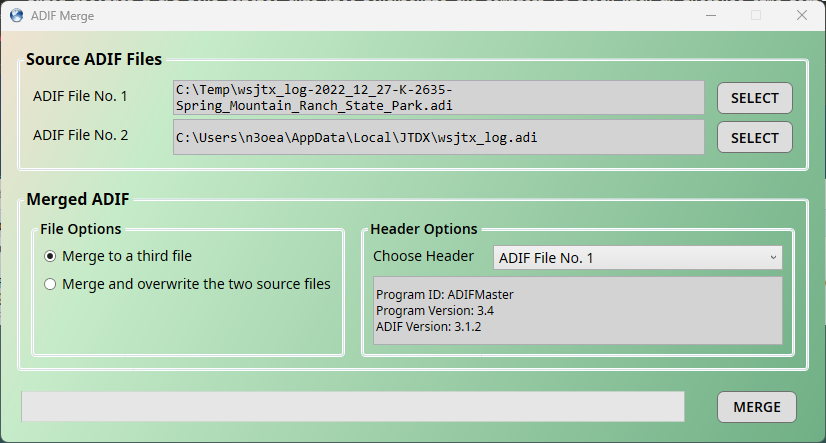
ADIF Merge
A consistent source of frustration is working with ADIF files. Each program tends to create its own file and keeping logs in sync is tedious at best. To help alleviate this is an ADIF Merge tool.
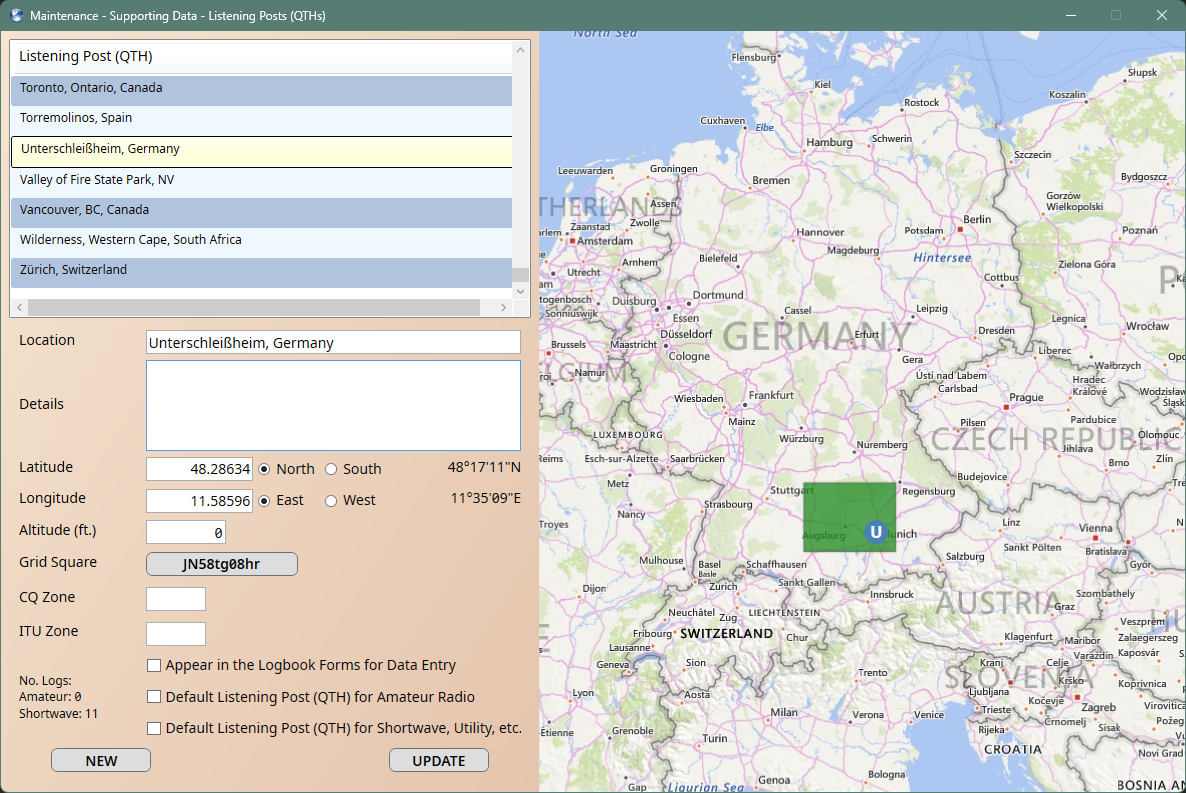
Listening Posts (QTHs)
Both the broadcast and amateur sides of the application share common listening posts. By centralizing listening posts, it provides a single point for adding and updating details. Most of the fields are optional. Since the listening posts are added to the list of cities for propagation predictions, having fairly accurate latitude & longitude values is useful. Another nice feature of this centralization is that precise edits can be made later.
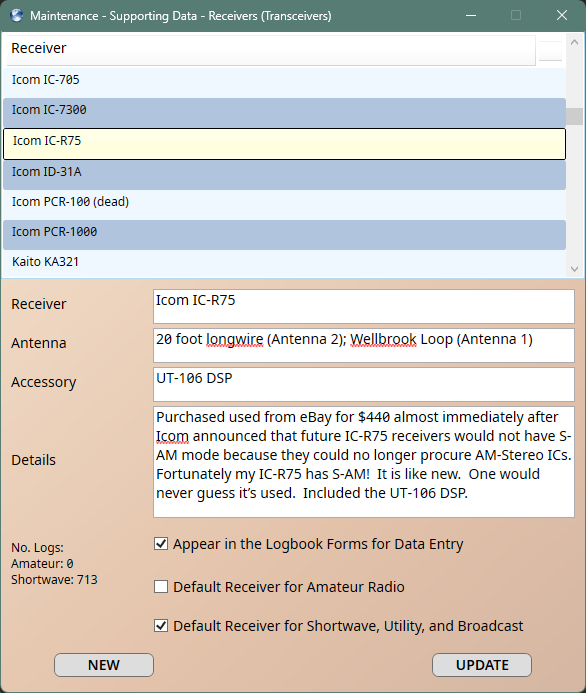
Receivers (Transceivers)
As with listening posts, receivers and transceivers too are centralized. Only the name of the receiver is required; however, the other fields can help to tell a little story about the radio, especially if you suffer from collecting too many radios and get things mixed up sometimes!
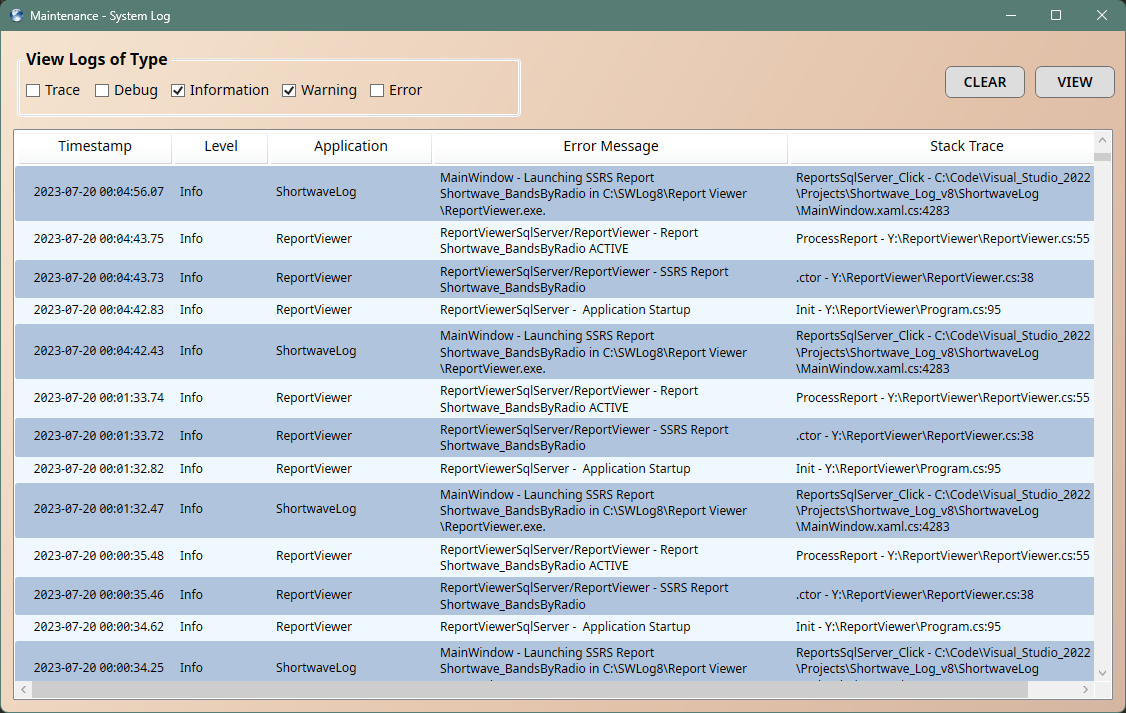
System Log Viewer
Taking advantage of the underlying database, all system logs are stored in the database and thus can easily be viewed. There are often more errors than expected as the mapping providers often impose throttling, thus throwing errors several times when trying to retrieve a tile. QRZ too throws a lot of errors in its XML implantation.
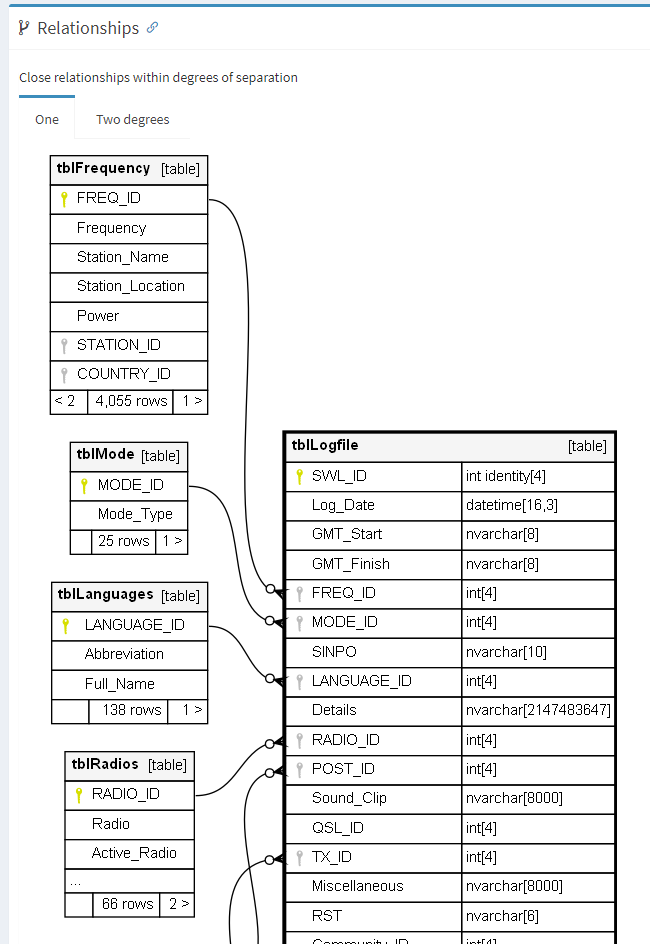
Database ERD
For the database wonks, a full ERD is provided. This is to aid advanced users in creating their own reports or with analyzing the underlying data structure.
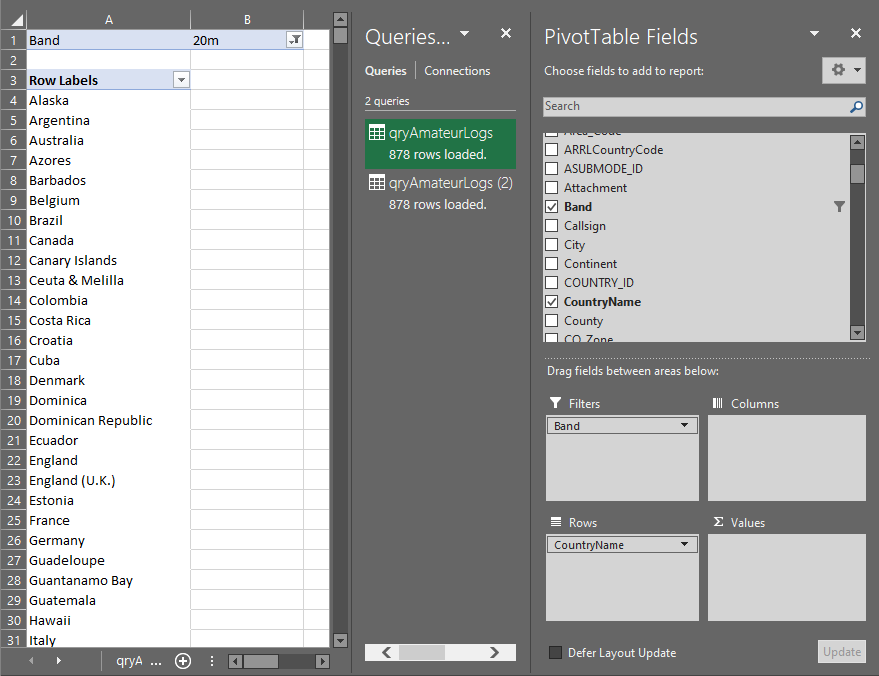
Excel or Power BI Integration - Pivot Table
Another feature for database experts is the ability to directly connect Excel or Power BI to the database and to create pivot tables, allowing for admittedly a level of analysis that is bordering on insanity. But that it the point! It is your logbook. Why would not you not examine it?
This example just shows country names by band; however, all the data awaits!
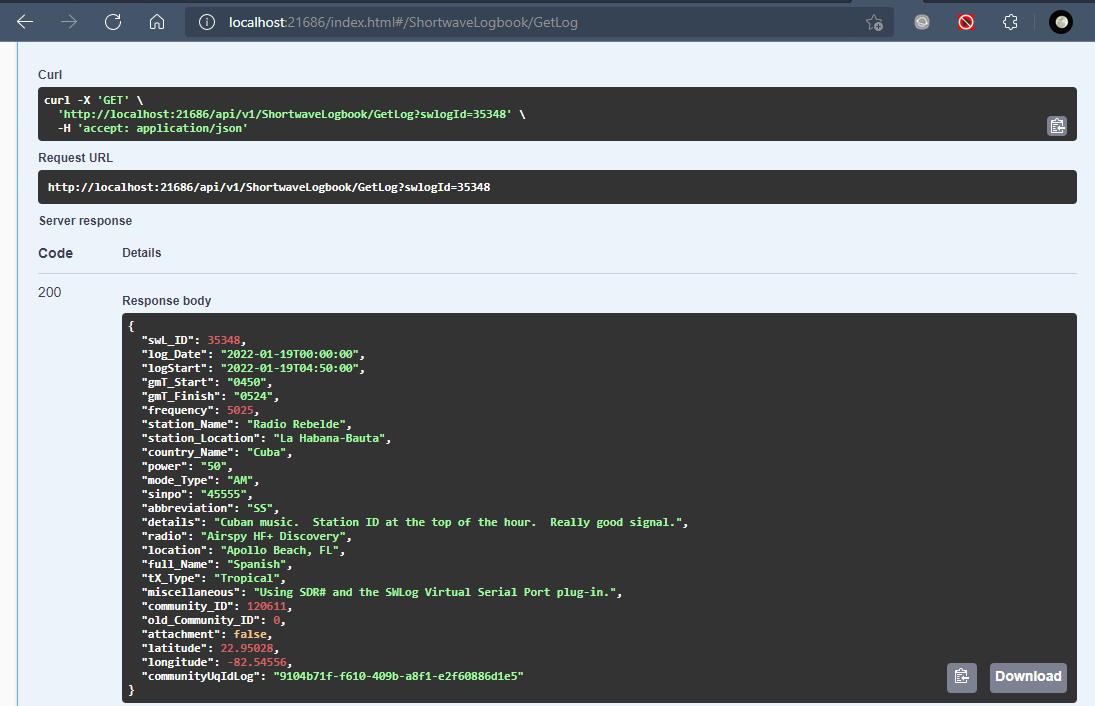
RESTful API
Both the main logging program and the radio control program provide RESTful APIs with Swagger documentation. The APIs can be used to extend the functionality of the system.