
Shortwave, Broadcast, & Utility Logging
The logging of shortwave and other broadcasts like AM/MW, beacons, utilities, weather stations, tropical stations, FM, &c. was the original focus of SWLog when it launched in 1988. The key feature has been combining disparate schedules such as HFCC, ILGRadio, SWSkeds, AOKI, ADDX, and EiBi into a single view so that all programs schedules can be queried in parallel to provide the most accurate results for station identification.
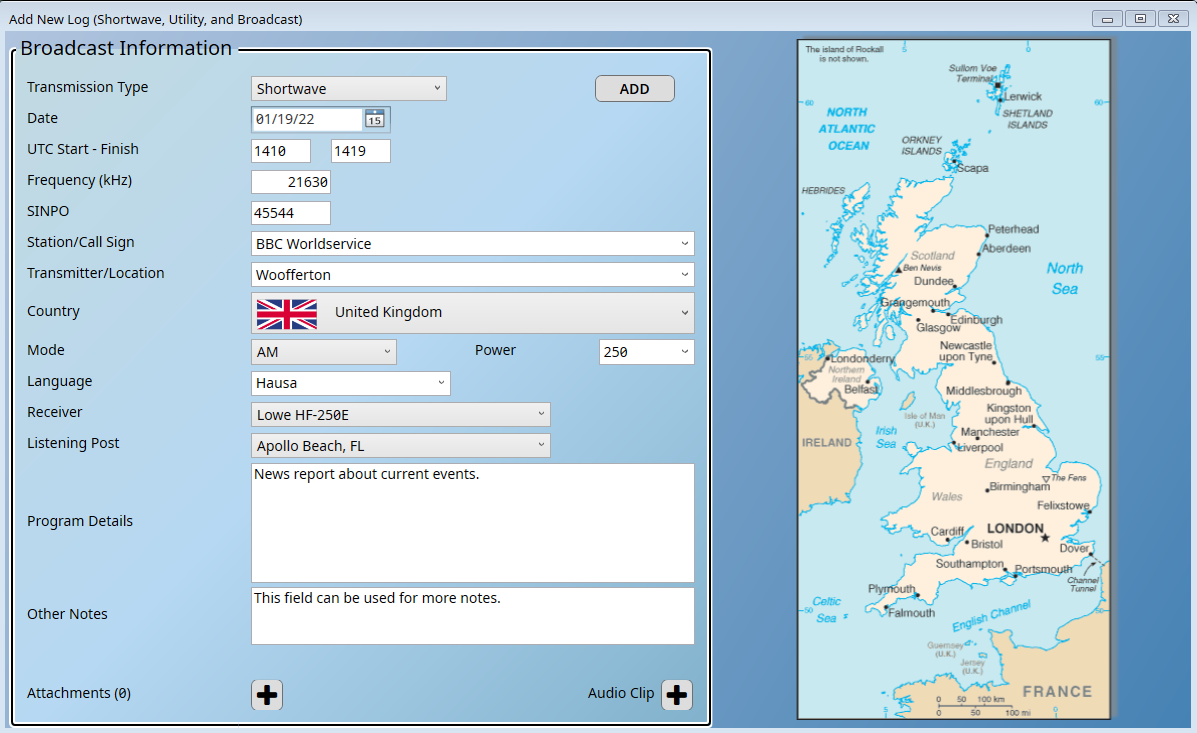
Add Log
Data from the various program schedule databases, plus the Shortwave Log Community, is queried in parallel to help identify the station.
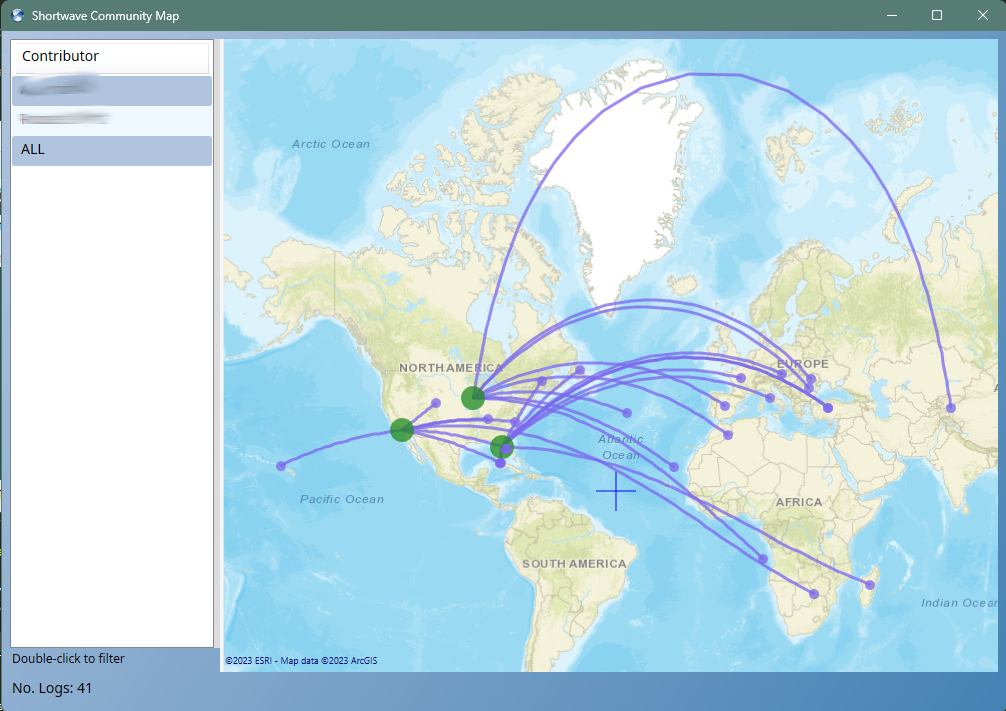
Community
The SWLog Community is a shared logbook. If enabled, logs are shared with other users to help identify stations and to provide a real-time view of what is audible on the bands. This is purely optional and is not enabled by default.
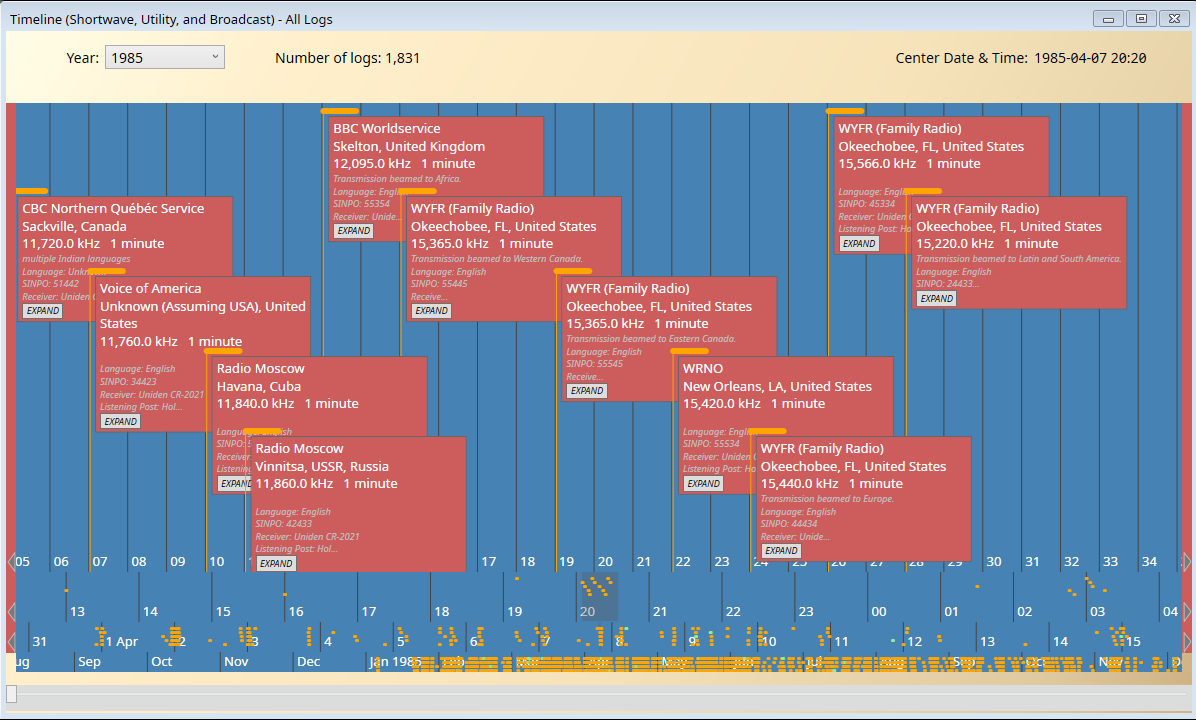
Time Line
The time line view shows each log chronologically as in a historical time line along the x-axis. Each log is represented by a dot in the year, month, or day row.
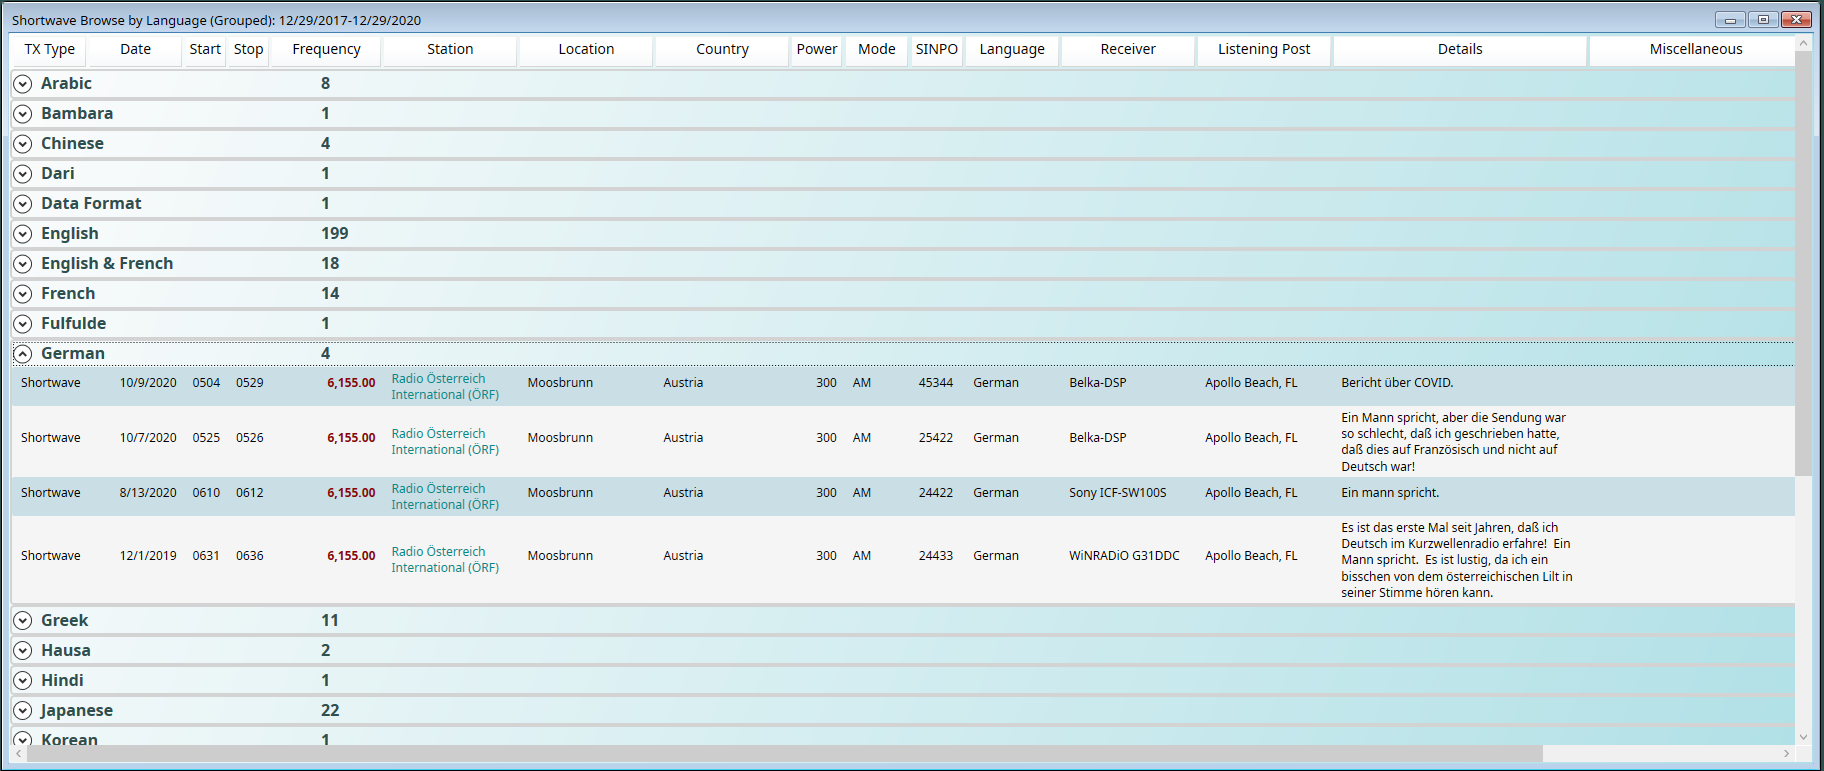
Browsing
When viewed in a grid, logs can be viewed flat or grouped. In this example, the logs are grouped by language.
Mapping Logs by Year
The logbook can be viewed as a mini-video of countries on a year-by-year basis.
Heat Maps
Many different types of heat maps are provided. In this example, the logs are mapped by radio.
WPN
WPN (What's Playing Now) is the key feature that queries all schedules in parallel, providing a unified list of all stations transmitting at a particular time.
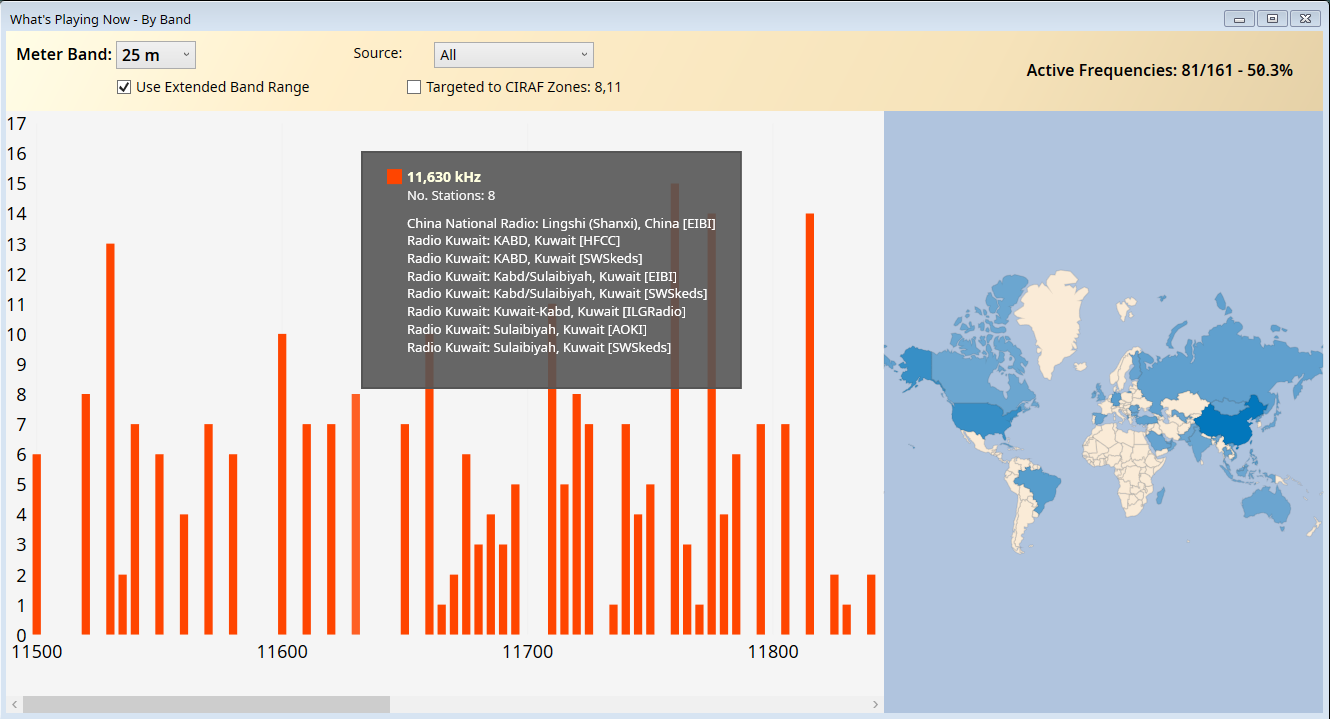
WPN by Band
WPN by Band shows all of the current transmissions on a specific band plus the countries currently transmitting.
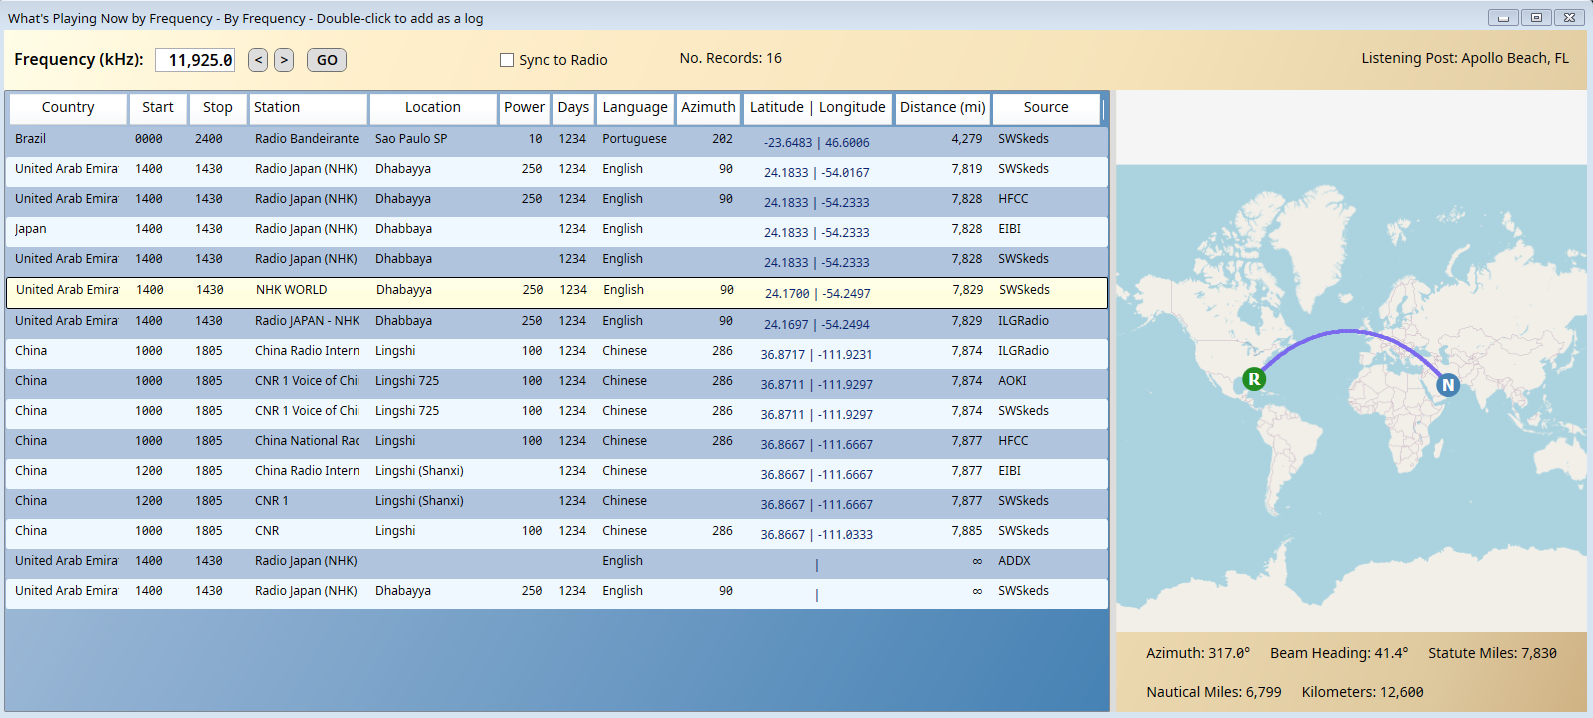
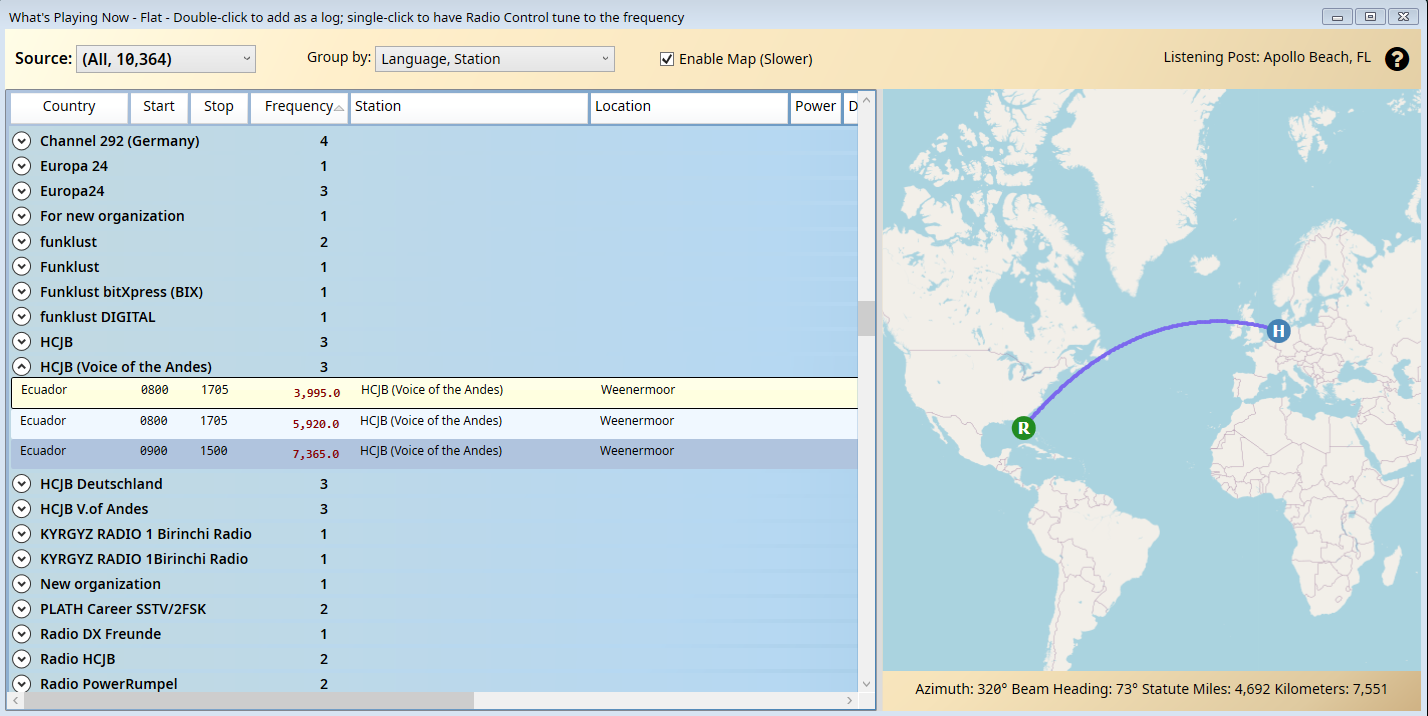
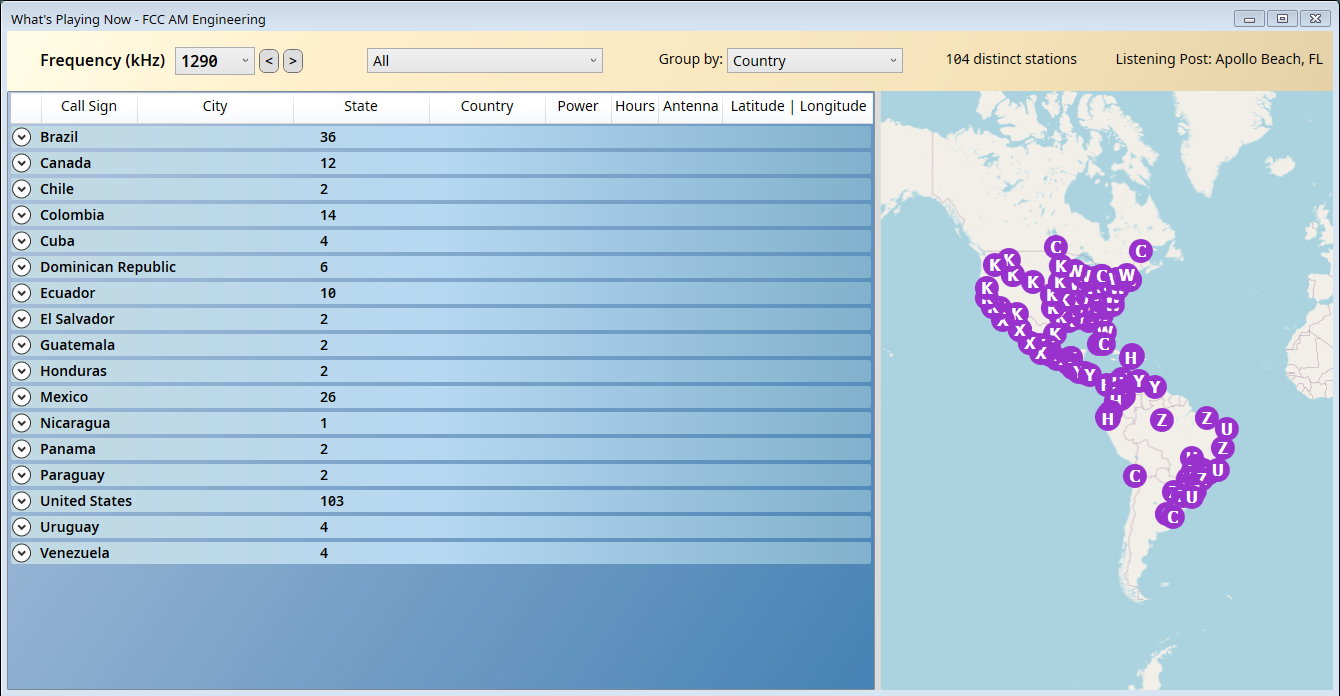
WPN by Frequency
WPN by Frequency shows all of the current transmissions on a specific frequency plus the short path to the listening post. This can also send a command to the Radio Control program to automatically tune the radio.
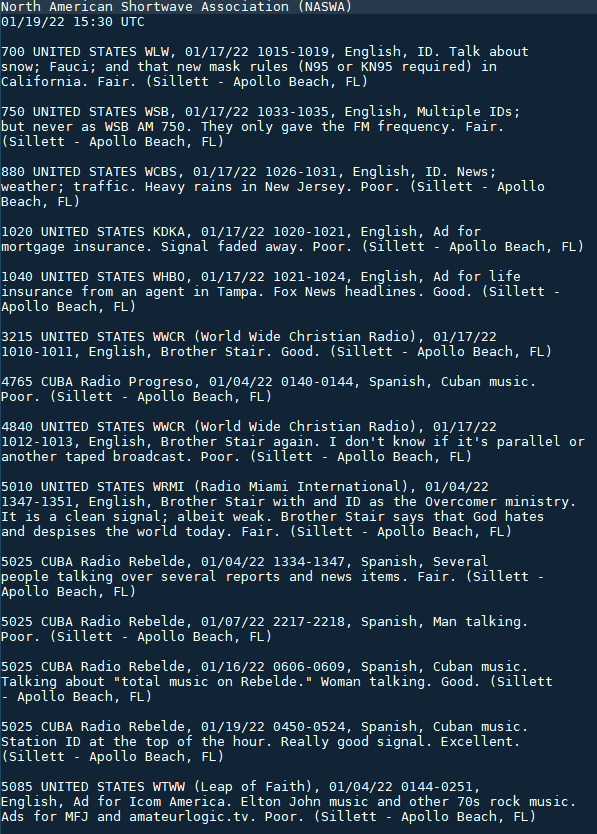
Club Logs
Specially formatted logs for ARDXC, BXDC, NASWA, NRC, and ODXA allow for club reports to be quickly sent. Three additional report types are also provided for non-specific reporting.
Importing & Exporting Logs
Logs can be imported from DXtreme Monitor Log, KB6IBB SWL Logger, or from standard CSV, pipe-delimited, or JSON formats. If the logs can be exported from the other application, there is a process to import them.
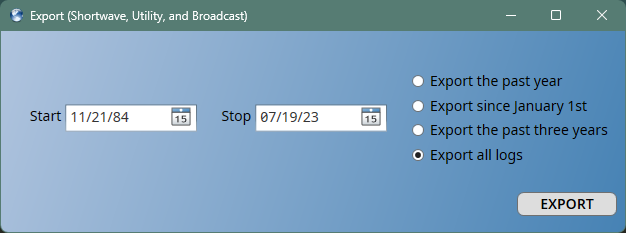
It is critical that logs are never locked-into SWLog. Logs can always be exported in a variety of industry-standard formats: CSV, TEXT, pipe-delimited, Excel, JSON, and XML. As the logs are stored in a database, the logs can also be exported via the database tools.
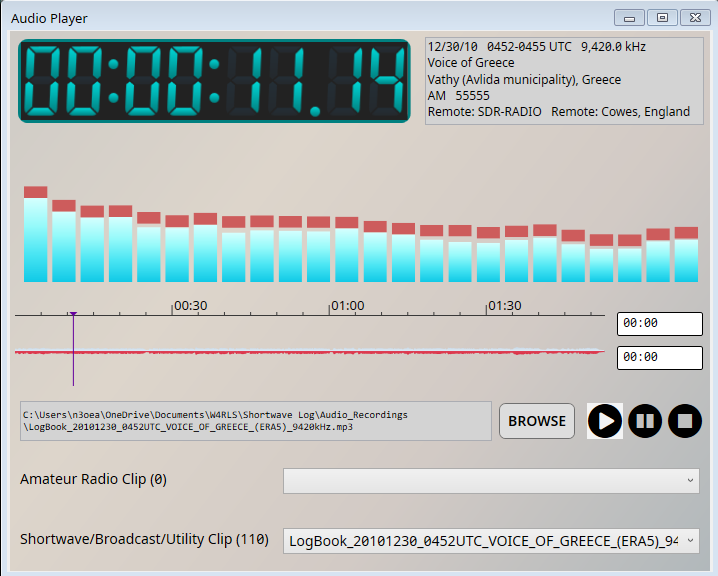
Audio Clip Management
A key aspect of broadcast radio monitoring is saving and playing audio clips. Audio clips can be attached to logs and then played directly from within SWLog.
FCC AM Engineering
Integrated support for the FCC AM Engineering database allows for analysis and exploration of all AM stations in the Western Hemisphere plus American territories and countries of Free Association.
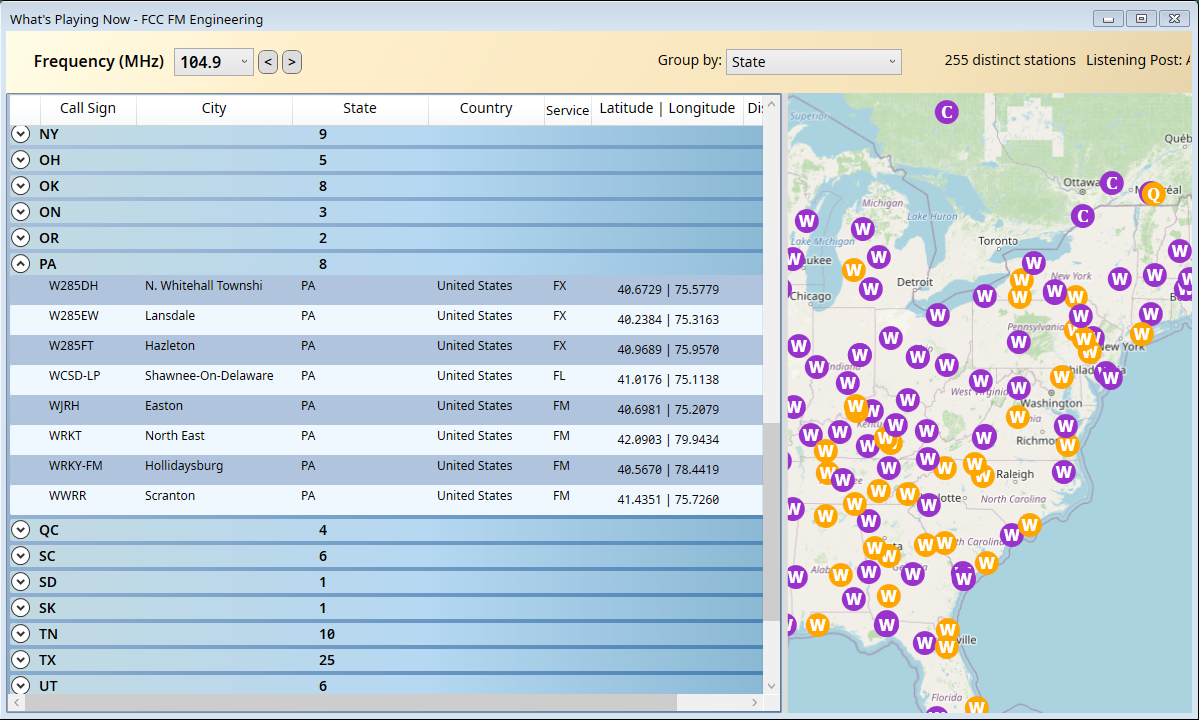
FCC FM Engineering
The FCC FM Engineering integration provides a similar level of detail for the United States, Canada, and Mexico.
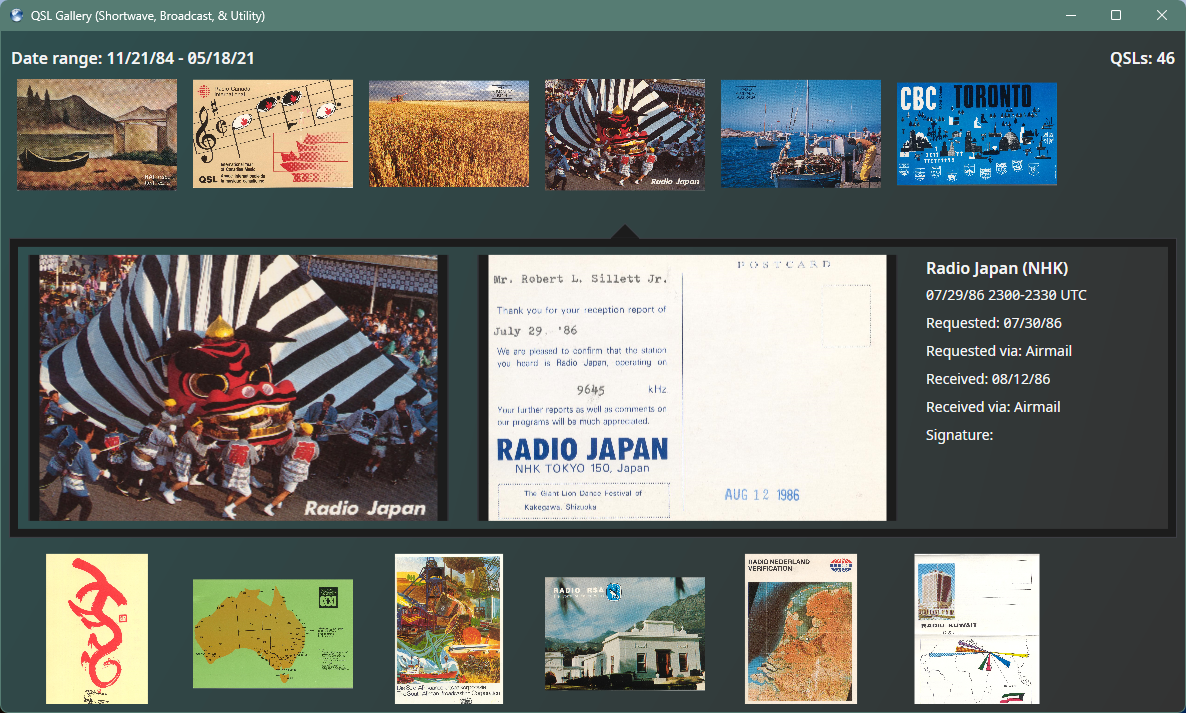
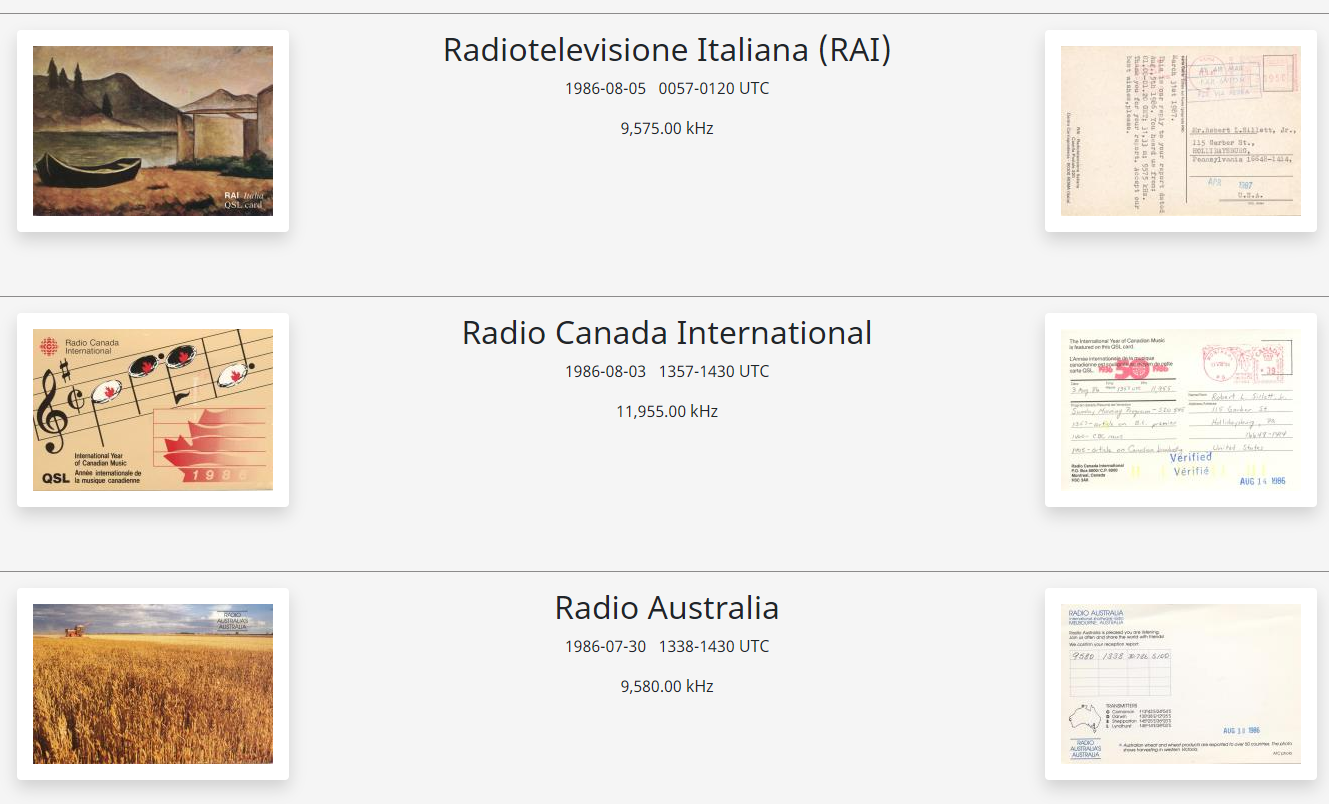
QSL Gallery
Shortwave, broadcast (AM/FM), and utility QSLs are displayed in a unified gallery.
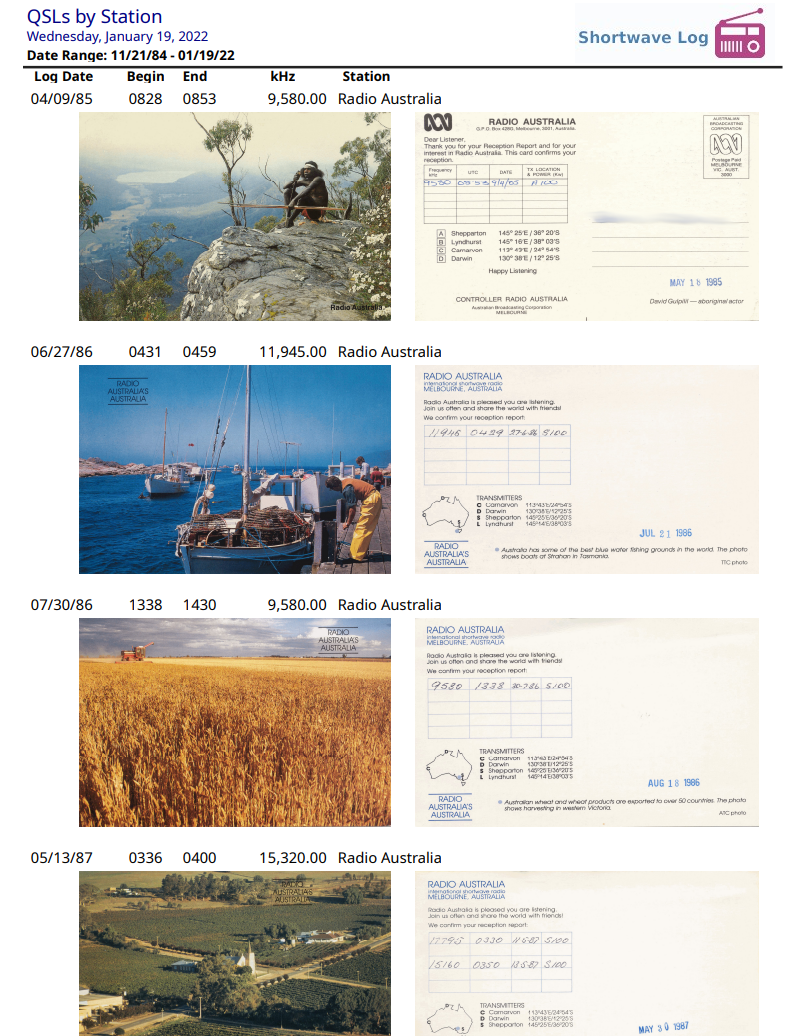
QSL Reporting
The status of QSL cards can be tracked from when the request was made, the type of request (e.g. electronic or physical), and when the QSL was received. Once received, the front and back of the QSL card can be attached to a log. A detailed report is available to show all QSLs.
QSL Web Page
An alternate way of viewing the QSL cards is to use SWLog to generate a web page, which can then be viewed locally or optionally published.
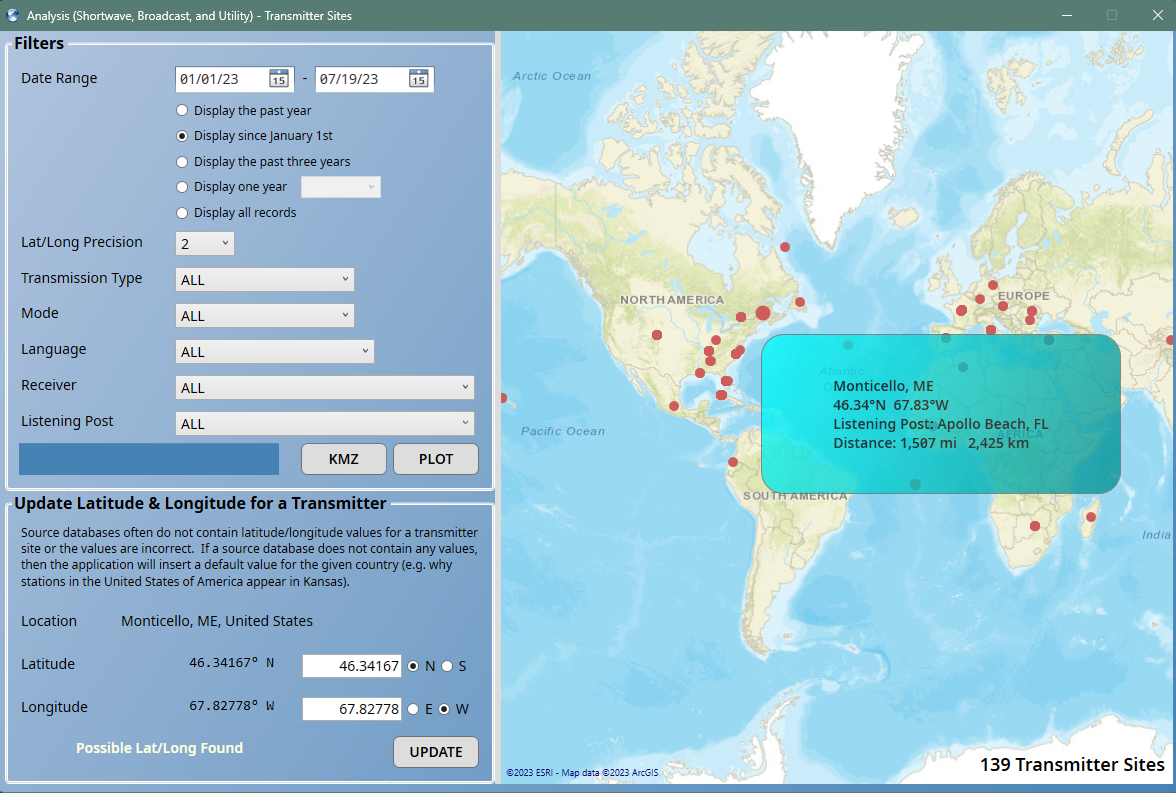
Analysis - Logs by Transmitter Sites
Logs can be analyzed and mapped by various parameters. This example shows logs by transmitter sites. The plots can optionally be exported to KMZ files for use by other programs.
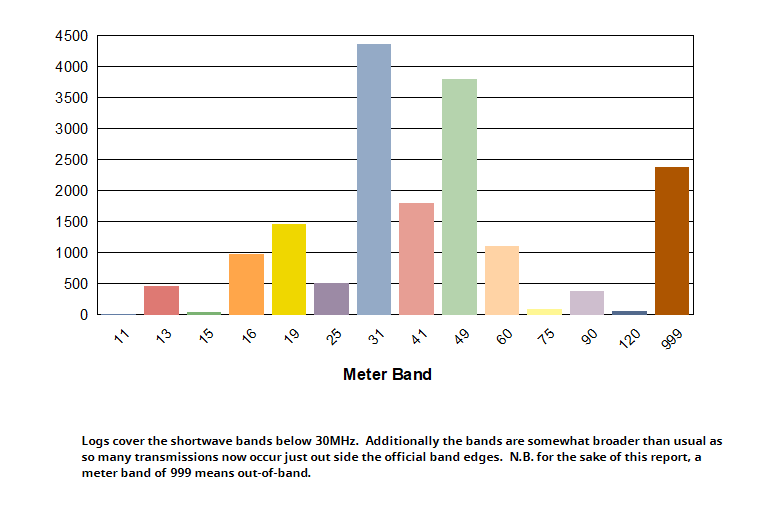
Analysis - Logs by Band
A myriad of reports exist to provide insights into the data, such as this report showing logs by meter band.
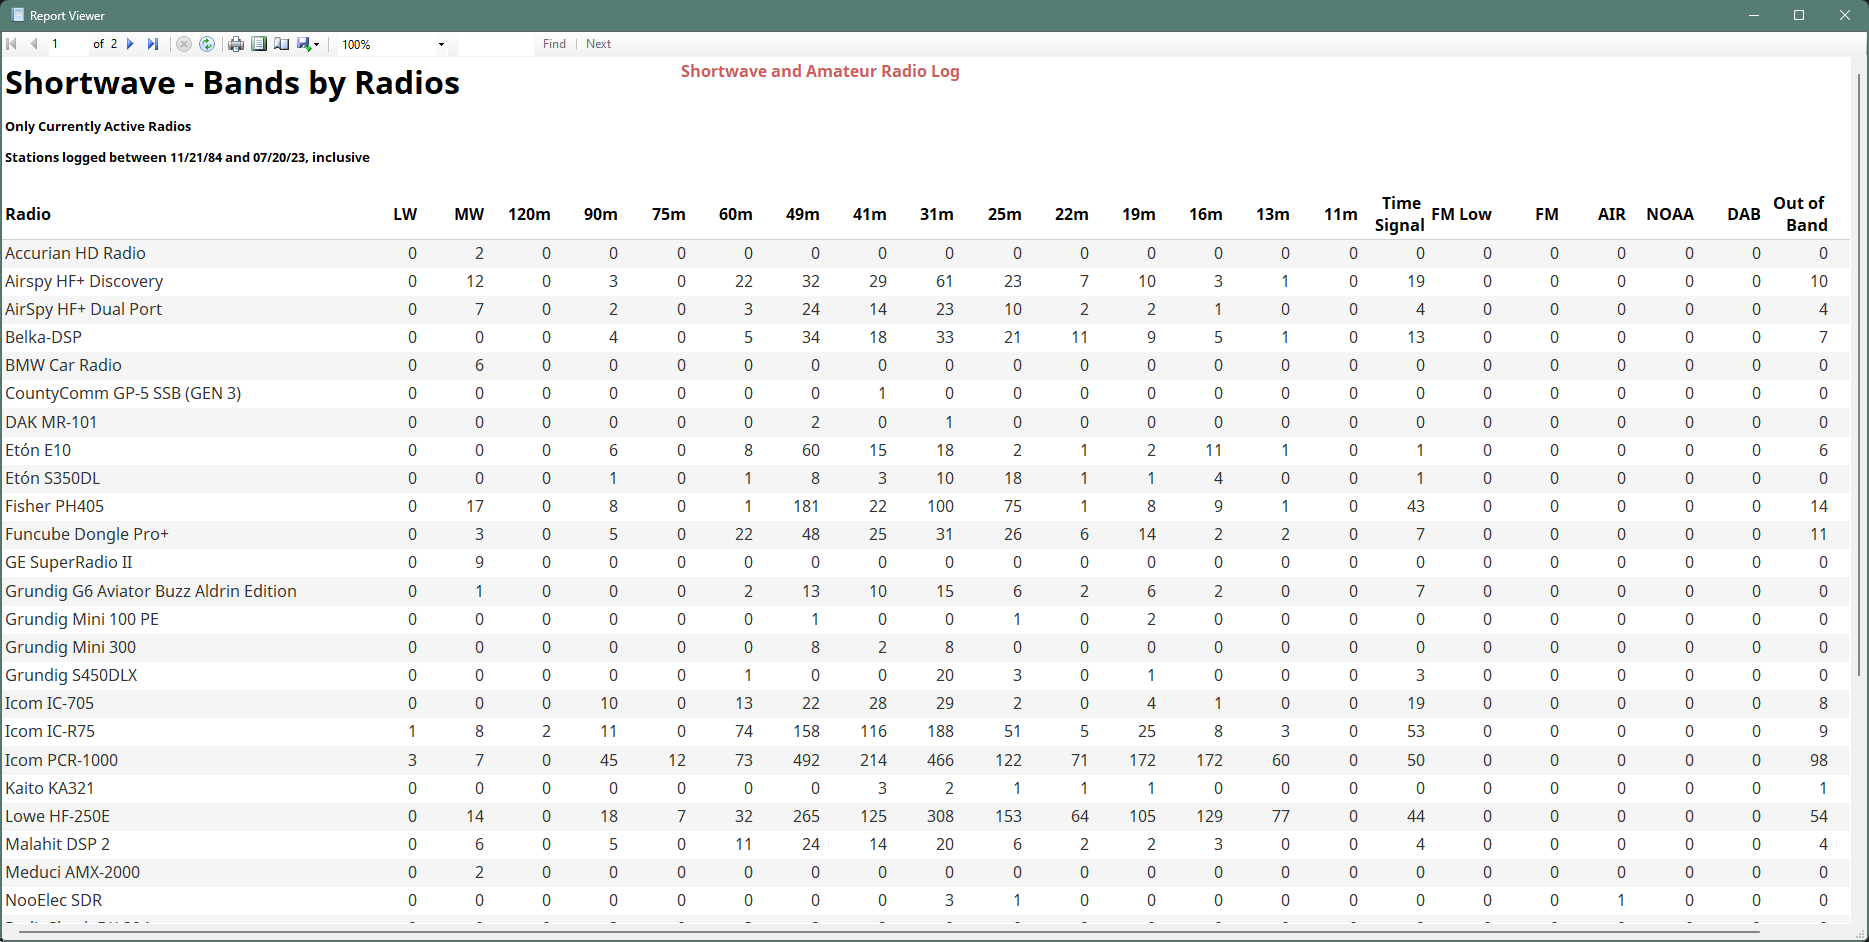
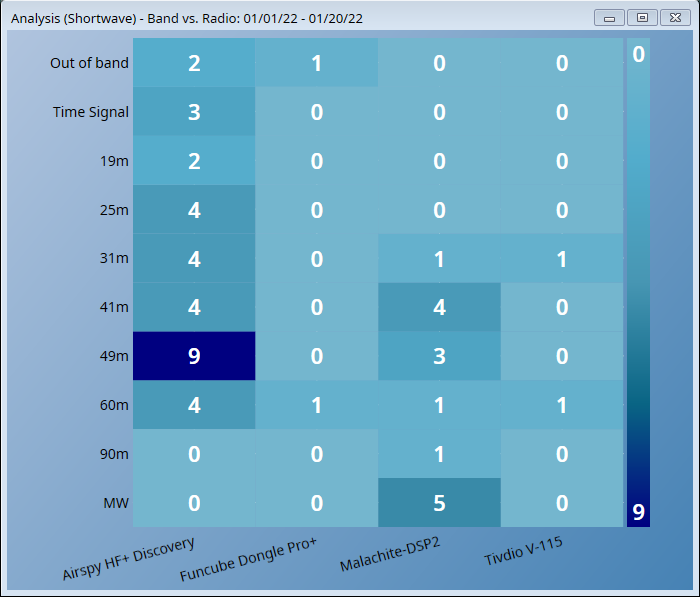
Analysis - Logs by Band and Radio
Another interesting view is to view the logs broken down by band and radio. This becomes particularly interesting if, like your friendly author, you have a bit of an obsession with collecting shortwave radios!